Building a B2B SaaS without the right metrics is like driving blindfolded. This guide covers the essential KPIs across four pillars: Revenue, Growth, Acquisition and Retention.
Focus on activations rather than signups, understand that metrics are interconnected, prioritize retention over acquisition and track Cost-to-Service alongside traditional metrics. Use the four-pillar framework to organize your dashboard, measure leading indicators like Lead Velocity Rate and remember that your LTV should be at least 3x your CAC for sustainable growth.
If you’re building a B2B SaaS company, your calendar is probably a blur of product stand-ups, pitch decks, feedback loops, and fire drills. You’re chasing growth, but at the same time, trying to build something that won’t break at scale.
In the middle of all this, metrics often become noise, either too surface-level to be useful or so deep they’re disconnected from daily decisions. But when you zoom out, it becomes clear: identifying the most important KPIs for a B2B enterprise SaaS marketing organization is a necessity for scaling efficiently and making better decisions, faster.
But the truth is, metrics are about revealing blind spots. The right B2B SaaS marketing metrics tell you where the engine’s leaking, which levers actually work, and what’s worth doubling down on.
We’re talking about a clear set of interconnected, founder-first KPIs that give you control over your growth story, not just a report of what happened last month.
Let’s unpack the metrics that matter.
Why SaaS Metrics Matter More Than You Think
Before we get into the metrics themselves, let’s get clear on why they even matter because it’s not just about data hygiene or investor updates.
In SaaS, you’re not selling a product. You’re earning the right to keep solving a problem month after month. That changes everything. The compounding nature of subscriptions means even a 2% uptick in retention or a slight drop in acquisition cost can swing your entire growth trajectory over time.
SaaS metrics are messy, interdependent and always in motion. Your CAC affects your CLV. Your churn messes with your MRR. And what looks like a marketing problem is often a product or onboarding issue in disguise.
Understanding these cause-effect loops is crucial.
The Four Pillars Framework
To make sense of the metric maze, you need to organize your dashboard around four core pillars:
- Revenue – How much predictable income is flowing in, and from where?
- Growth – Are you accelerating sustainably, or just burning through capital?
- Acquisition – Are your efforts to bring in new users efficient and scalable?
- Retention – Are you delivering enough value for customers to stay, expand, and refer?
This is a diagnostic framework. Think of it like a SaaS health check: revenue shows the current state, growth shows potential, acquisition tells you how well your engine works and retention reveals whether your product is truly solving a problem.
When these four areas are tracked together, patterns emerge. You’ll spot bottlenecks, see what’s compounding value and make decisions grounded in context.
Revenue Metrics
Monthly Recurring Revenue (MRR)
This is your north star metric. MRR shows you the predictable revenue coming in each month from subscriptions. MRR helps you forecast, plan resources and make strategic decisions.
Pro tip: Break down MRR by cohorts, pricing tiers and customer segments to identify patterns and opportunities.
Annual Recurring Revenue (ARR)
While MRR gives you month-to-month visibility, ARR provides the bigger picture. It’s especially important for enterprise SaaS companies with annual contracts. ARR helps with long-term planning and is often what investors want to see.
Average Revenue Per User/Account (ARPU/ARPA)
This metric tells you how much revenue you’re generating per customer. It’s crucial for understanding pricing effectiveness and identifying upsell opportunities. A declining ARPU might signal that you’re attracting lower-value customers or that your pricing strategy needs adjustment.
Growth Metrics
Customer Acquisition Cost (CAC)
CAC tells you how much you’re spending to acquire each new customer. Calculate this by dividing your total sales and marketing expenses by the number of new customers acquired in that period.
But here’s where it gets interesting, as CAC only makes sense when compared to Customer Lifetime Value (LTV).
Customer acquisition cost has increased 14% for new customers over the last year, which makes it even more critical to focus on acquisition efficiency and retention to protect your margins.
Customer Lifetime Value (LTV)
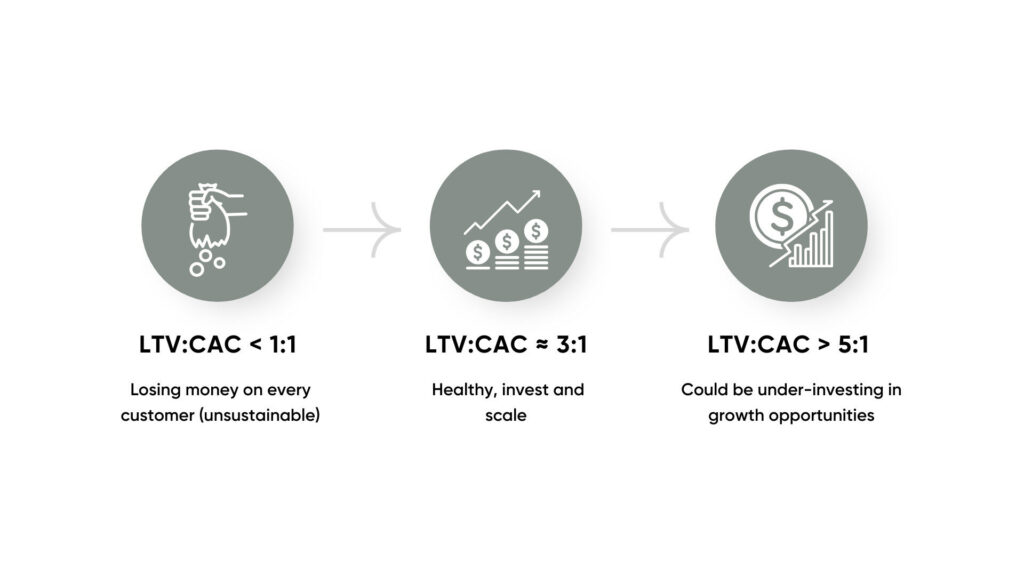
LTV predicts the total revenue you’ll generate from a customer over their entire relationship with your company. The golden rule says your LTV should be at least 3x your CAC. This ratio reveals whether your customer acquisition efforts are profitable.
Lead Velocity Rate (LVR)
This often-overlooked metric measures the month-over-month growth rate of your qualified leads. LVR is a leading indicator of future revenue growth and helps you identify whether you’re on track to hit your quarterly and yearly goals.
LVR is like your early warning system. It often predicts revenue trends 1-2 months before they show up in your actual revenue numbers.
Acquisition Metrics
When it comes to B2B SaaS marketing KPIs, focusing on metrics that reflect actual revenue contribution is far more valuable than surface-level indicators.
Instead of obsessing over vanity metrics like impressions or total traffic, smart teams double down on B2B SaaS marketing metrics that connect to pipeline health and revenue.
Marketing Sourced Revenue (MSR)
Instead of just tracking marketing spend, focus on Marketing Sourced Revenue. This metric shows how much revenue can be directly attributed to your marketing efforts.
The beauty of MSR is its flexibility. Depending on your goals, you can measure ROI through direct cash returns, increases in Sales Qualified Leads (SQLs), Marketing Qualified Leads (MQLs), or even newsletter subscribers.
Activations vs. Signups
Here comes a game-changer: stop obsessing over signups and start tracking activations instead. An activation is the first time someone uses your product in a way that demonstrates they’re getting value from it.
This shift in focus is especially crucial for product-led growth companies. Activated users who become Product Qualified Leads (PQLs) are much more likely to convert to paying customers and help optimize your paid advertising algorithms.
Organic Traffic Leads
Organic traffic leads are a key leading indicator of future MRR growth. Building a solid organic growth funnel reduces your dependence on paid acquisition and improves your unit economics over time.
Retention: The Make-or-Break Category
Churn Rate
Customer churn rate shows the percentage of customers who cancel their subscriptions in a given period. But don’t just track the number, understand the “why” behind churn through exit interviews and usage data analysis.
Net Revenue Retention (NRR)
NRR measures how much revenue you retain and grow from existing customers over time, accounting for upgrades, downgrades, and churn. A good NRR rate is above 100%, meaning you’re growing revenue from existing customers faster than you’re losing it to churn.
“Profit in business comes from repeat customers, customers that boast about your product or service and bring friends with them.”
— W. Edwards Deming
Companies with more than $50M in ARR now see over 40% of their total new ARR coming from expansion revenue. That’s why retention and upselling aren’t side plays—they’re core growth levers as you scale.
Net Promoter Score (NPS)
While not strictly a financial metric, NPS predicts customer loyalty and future growth. Customers who are promoters (score 9-10) are more likely to renew, upgrade, and refer others to your business.
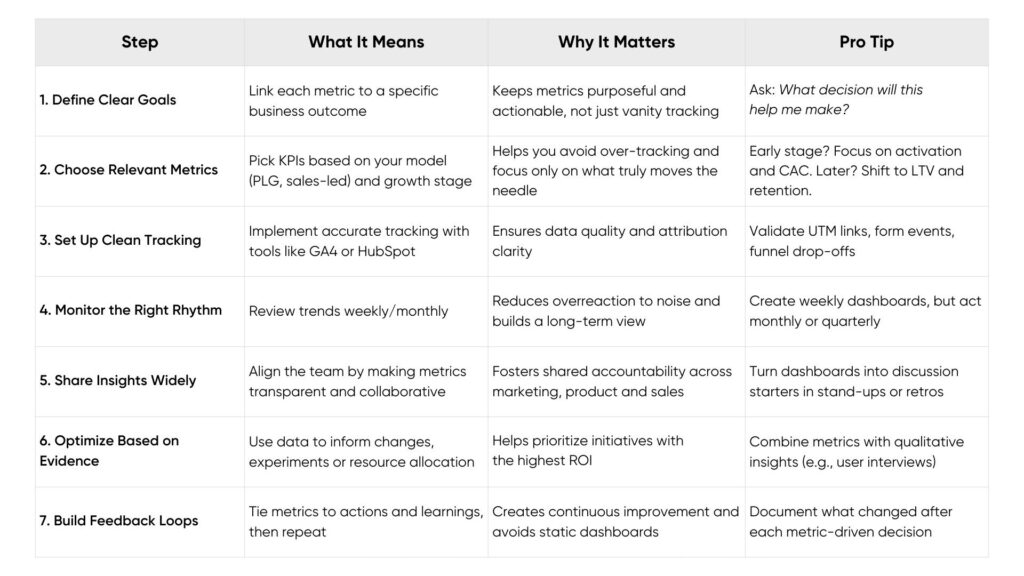
How to Track These Metrics
Having the right B2B SaaS marketing KPIs and tracking them effectively is only half the battle. Here’s a practical approach to implementation:
The Interconnectedness Factor
Remember, metrics don’t live in silos. If you’re treating them like isolated numbers on a dashboard, you’re missing the bigger picture. The real power comes from understanding how they influence each other because that’s where you uncover what’s working, what’s leaking, and what needs fixing.
CAC vs LTV
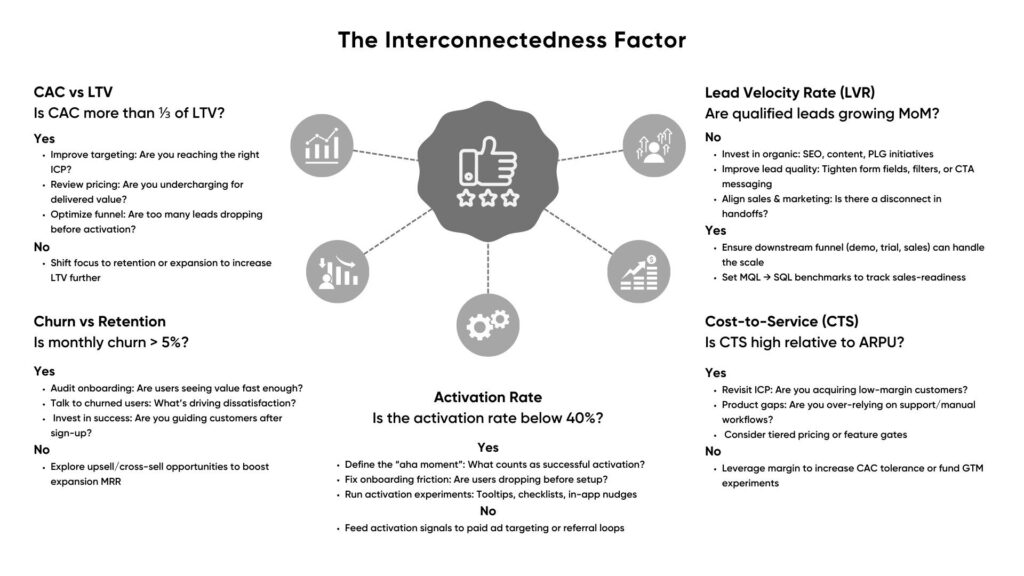
Example in action:
Say your CAC is Rs. 5000, and your LTV is Rs. 9000. On the surface, it looks okay, but you realize your churn rate is creeping up, and your activation rate is only 25%. That’s a red flag.
You’re likely spending a lot to acquire users who never fully onboard, which tanks retention and inflates CAC. Instead of pumping more into ads, you might get better ROI by fixing onboarding flows, clarifying positioning, or requalifying leads before sign-up.
Making It All Work Together
The key to successful SaaS metrics tracking isn’t collecting more data, it’s collecting the right data and understanding how different metrics influence each other.
Start with the four-pillar framework (Revenue, Growth, Acquisition, Retention), choose 8-10 core metrics that align with your business goals and gradually add secondary metrics as you scale.
Most importantly, use these metrics to drive action, not just to create a dashboard. Every metric you track should have a clear connection to a business decision or optimization opportunity.
Remember: the goal is to have actionable insights that help you build a more successful, sustainable business.
About The Wise Idiot
We’re The Wise Idiot, and yes, that’s really our name. We’re a content marketing agency that’s been helping startups and growing brands tell their stories since 2017.
Here’s what we do: we take the stuff that makes your business special and turn it into content that actually works. Whether that’s writing that doesn’t put people to sleep, websites that make visitors stick around, or social media that gets people talking, we handle it all.
FAQs
What is the most important metric for a B2B SaaS founder to track?
Monthly Recurring Revenue (MRR) is foundational, but it becomes more powerful when tracked alongside Churn, CAC and LTV. These together give a full view of revenue quality and sustainability.
What’s a good CAC to LTV ratio for a SaaS business?
A healthy ratio is 3:1. If it’s less than 1:1, you’re losing money per customer. If it’s more than 5:1, you might be under-investing in growth.
How is Net Revenue Retention (NRR) different from Gross Revenue Retention (GRR)?
GRR only accounts for churn and downgrades, while NRR also includes expansions and upsells. A strong NRR (>100%) means you’re growing from your existing customer base even with some churn.
Why is activation more important than signups?
Because signups don’t equal value. Activation shows when users actually experience value, which directly impacts retention, monetization, and product-led growth.
What tools should I use to track SaaS metrics?
Use tools like GA4, Mixpanel, Amplitude, HubSpot, ChartMogul, or Baremetrics. More important than the tool is clean setup, proper attribution, and consistent analysis.